Creator | Martin Roberts | GB |


IB
|Internal Assessment|

|Marking criteria|
|Criterion A: Fieldwork question and geographic context |
The fieldwork question (the precise inquiry) guides the fieldwork investigation. It must be focused, appropriate and stated as a question that can be answered through the collection of primary information in the field. Where appropriate, students can make a brief preliminary judgment or prediction answering the fieldwork question. This prediction may be formulated as a hypothesis.
Students must also comment briefly on the geographic context, explaining why and where the fieldwork investigation is to be carried out. This can include relevant spatial, physical, socio‑economic conditions and other background information, concepts or characteristics. A map of the research area and/or the locations used in the fieldwork investigation is essential to provide the necessary spatial element.
Students must also state the area(s) of the syllabus to which the study relates, which geographic inquiry topic or sub-topic in the syllabus, whether it is from the optional themes, the core theme, or the HL extension. It can be drawn from a combination of two or more topics or themes.
This criterion assesses the focus and geographic context of the fieldwork and to what extent the link between the fieldwork question and the geographic context (that is, material in the syllabus, a relevant syllabus topic or geographical theory) is made clear. The fieldwork question should be specifically geographical.


|Use the Project planner to track your progress|
|Tip:Take a listen|
|Front Cover|

|A clear title of investigation. Ensure to refer to a specific location regarding place and a geographical model.|
|Ensure to provide the word count which is a max of 2500 words. Dont go over the word count.|
|Add an image if you want. Make sure it is an image that is relevant to the coursework.|
|Make sure not to have page number on your front page.|
|Contents Page|

|Add Heading 1s for the main sections of the IA|
These are:
-
Introduction
-
Methodology
-
Data Analysis
-
Conclusion
-
Evaluation
-
Bibliography
-
Appendix
|Add maps and Images to your Bibliography.|
|Introduction|
|Make sure to add page numbers to your document.|

|Add a clear Aim (word count 50 words)|
-
Ensure to the reason as to why you are conducting this research
-
What part of the curriculum does it cover.
-
When was the research gathered?
-
What to aim to achieve through this research?
|A clear title for each sections to help structure your report.|
|Add a well labelled map of the area where the research is going to be conducted.
Tip: Add more than one map to create a detailed context of place.|
|Example of Mapping Techniques|


|Mapping using ARCGIS|
| Build interactive web maps with ArcGIS Online, Esri's web-based mapping software. Gain new perspectives and enhanced details as you interact with data, zoom in, and search on the map. Use smart, data-driven mapping styles and intuitive analysis tools to gain location intelligence. Share your insights with specific groups or the entire world.|

|Introduction Page 2|

|Location: Help create context as to where the data is going to be collected.|
|Have a Geographical model that is relevant to the coursework and that has been explained and researched. |
|Ensure to have a depiction of the model chosen and spent some time to contextualise the image. |
|Examples of geographic models|


|The Bradshaw Model|
|The Schumm's Model|
|Hjulström curve|
|Recontextualisation of models|


|Introduction Page 3|


|A clear subtitle is given.|
|With only 2500 words at your disposal you need to ensure that you can prove or disprove your hypothesis at the end of your IA. So less is sometimes more. Choose three Hypotheses that you will be able to prove or disprove and explain your findings.|


|Criterion B: Method(s) of investigation|
Students must describe the method(s) used to collect information. The description may include technologies employed, sampling techniques, time, location and circumstances of information collection where relevant.
The method(s) used must be justified and must enable a sufficient quality and quantity of primary data to be produced to allow the fieldwork question to be investigated.
This criterion assesses the description, justification and appropriateness of the method or methods including sampling and surveying techniques, primary or secondary data collection as appropriate used to investigate the question formulated.

|Give a clear title of investigation, this helps guide the reader and help the examiner allocate the marks to the right criteria.|
|Conduct a pilot study prior to collecting your data to help improve the overall results. It helps reduce human error and bias, increases accuracy and increases the reliability of your results.|
|Method: How are you going to use the named equipment above to gathered the required data. Ensure to keep this short and detailed.|
|Methodology|
|Constructing Hypothesis|
1. Ensure that your Hypothesis is a statement.
2. Keep the Hypothesis simple and easy to understand.
3. Make sure they are measurable.
4. Make sure at least two are complex, meaning there are two or more variables found in the hypotheses (this allows you to identify patterns and make connections between variables).
|Equipment: What equipment will you use to gather this set of data, list them.|
|Techniques|


|Justification (sampling) |
Random sampling
Random sampling = is a part of the sampling technique in which each sample has an equal probability of being chosen. A sample chosen randomly is meant to be an unbiased representation of the total population.
Stratified sampling
Stratified sampling = is a type of sampling method in which the total population is divided into smaller groups or strata to complete the sampling process.
Systematic sampling
Systematic sample = requires you to gather data at regular intervals.
For example, every 1 metres along a line running from one river bank to the other data is collected for depth.
Pragmatic sampling
Pragmatic = essentially safety, accessibility and the use of prior knowledge. For example, if a student is carrying out a river investigation they might use pragmatic sampling methods meaning only areas that are easily accessible and did not pose a risk would be studied. It is reliable and practical.
|Justification |
Accuracy
Accuracy means how close a measurement is to the true value.
The closer a measured value is to the true value, the more accurate it is. The further a measured value is from the true value, the greater the error.
Reliable
Reliable means consistently good in quality or performance; able to be trusted.
How are you going to repeatedly gather data ensuring top results?
Representative
Representation refers to the description or portrayal of someone or something in a particular way, in this case the river. At each site how are you going to choose a site that represents that particular course or part of the river?
Bias
Bias is a tendency to lean in a certain direction, either in favor of or against a particular result. To be truly biased means to lack a neutral viewpoint on a particular topic. So what are you going to do so that your results arent falsified and are as true as possible?

|Criterion C: Quality and treatment of information collected|
Students should treat and display the information collected using the most appropriate techniques. These techniques must be the most effective way of representing the type of information collected and must be well used. The precise techniques employed will differ depending on the nature of the fieldwork question but may include statistical tests (including confidence limits), graphs, diagrams, maps, annotated photographs and images, matrices and field sketches.
Students must also refer to the geographic context, information collected and the ways in which the material has been treated and presented.
This criterion assesses the quality of information and data collected and its suitability for analysis in criterion D, whether it is appropriate and a sufficient range of techniques have been used for the presentation of information, and whether the presentation follows accepted conventions (that is, the numbering, labelling, and annotating of tables, graphs and diagrams).
|Data Analysis|

|A clear title of investigation to ensure the examiners knows what hypothesis this belongs too. |
|Each graph/ map or illustration needs to have a title. |
|For each graph an in-depth analysis must be done.
-
Make sure to have less graphs, but those that you do have are are well constructed and show composite variables(two or more variables) rather than simple graphs that show single variables.
-
Design your own methods of displaying data.
-
Also, incorporate diagrams and images to highlight anomalies. |
|Graphing Techniques|


|If you want to construct a cross-sectional area diagram using your data digitally click on the logo. |

|CLICK ON ME|
|CLICK ON ME|
|IMPROVE YOUR ANALYSIS|
|Improve your work|
|If you want to use spearmans rank to add depth of your analysis. Click on the link and input your data.|

|Criterion D: Written analysis|
In the written analysis, students must demonstrate their knowledge and understanding of the fieldwork investigation by interpreting and explaining the information they have collected in relation to the fieldwork question. This includes recognizing any trends and spatial patterns found in the information collected. Where appropriate, an attempt should be made to identify and explain any anomalies.
The treatment and display of material and the written analysis must be integrated within this section.
This criterion assesses the quality of the analysis of the results, referring to:
-
links to the question and hypotheses formulated
-
geographic context (that is, geographical theory, the syllabus, or the relevant syllabus topic)
-
information collected
-
statistics used (descriptive techniques—that is, graphs, charts, histograms and so on; as well as statistical techniques—that is, correlations, regression, and so on)
-
illustrative material.
|Written Analysis|

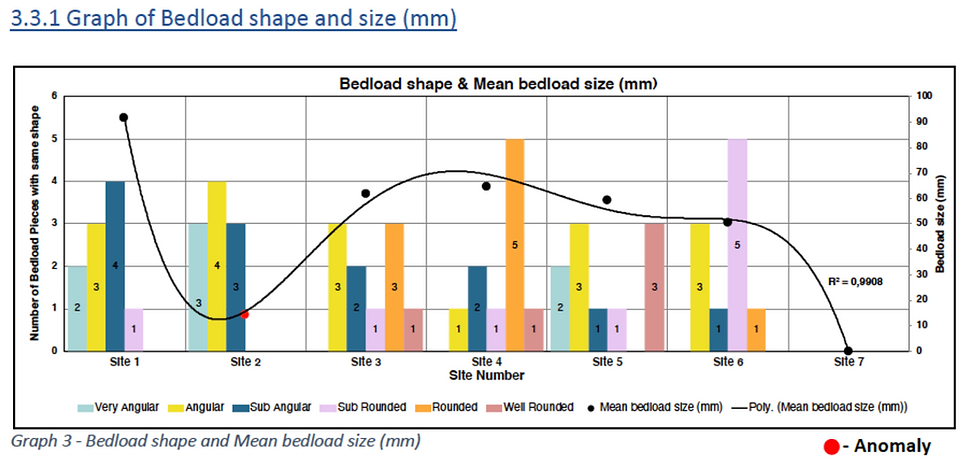
Graph 3 shows a reducing trend when referring to mean bedload size and an increase in bedload roundness, as the river proceeds downstream. The bedload in the upper part of the course has the largest size and is mostly angular or sub-angular in shape.
This is because the bedload has not significantly been eroded and transported yet. Throughout the further course of the river erosion, in form of abrasion, occurs through the transportation of bedload by traction, this increases the probability of attrition[1] (Bennett, 2018) as the bedload collides with the rough channel bed and other bedload.
This then leads to the bedload becoming smaller and rounded enough to be transported by saltation, in which the bedload is moved in a “leap-frog” motion. In the lower part of the course, the load of the river is transported through suspension[2] (Nagle & Cooke, 2017, p. 2) in the river. Therefore, at Site 7 there is no measurable bedload.
Site 2 can be said to be an anomaly as it does not support the trend of the mean bedload size. This can be explained, to be a result of the lose sediment surrounding the river channel as well as the obstruction of the site through debris that has not been eroded from the source of the river. An anomaly for bedload roundness can be identified at Site 5, as the mode bedload is angular in shape. This is due to the embankment of the river, with boulders, for the underpass of a bridge, which then enters the river channel due to lateral erosion.
Explain: Try and give a detailed explanation as to why the variable changed. Refer to physical and human processes. Erosion|Transportation|Deposition are key processes that play a large role in every river. Also, what human factors have led to the pattern found in your data.
Anomalies: Firstly, identify the anomalies. What site/s did they occur. Once, that has been identified. Try and find an explanation for these. These explanations need to have evidence to be able to back up your claims. So make sure to add images or refer to other graphs and variables to build your argument
|Describe: Ensure to provide an outline as to the overall trend/relationship. Also, start to quantify(use the numbers to show how the data changes as we move downstream. |
|Further examples|


Add an Infographic to your conclusion to add more to your project. This can demonstrate the path of enquiry.
|Criterion E: Conclusion|

Students should summarize the findings of the fieldwork investigation. There should be a clear, concise statement answering the fieldwork question. It is acceptable for the conclusion to state that the findings do not match the student’s preliminary judgment or prediction.
This criterion assesses the ability of the student to summarize the findings of the fieldwork investigation and draw a supported conclusion.
|Conclusion|

|Add A clear title|
|A clear subtitle for each of your hypotheses. |
|Ensure to give an end statement to answer the question. Keep your answer concise and ensure to make a statement that is clear and measured.|
|Due to the extreme anomalies and the Rs value, we accept that the River Modau does not conform to the Bradshaw Model for average velocity. However, it fully conforms in terms of cross-sectional area.
The Rs value between these two variables is less than the critical value, therefore, we accept the Null Hypothesis (H0) at the 0,1-significance level, stating that there is no significant statistical correlation.|
|Criterion F: Evaluation|
Students should review their investigative methodology, including methods of collecting primary information. Within this, they should consider any factors that may have affected the validity of the data, including personal bias and unpredicted external circumstances such as the weather.
Students should suggest specific and plausible ways in which the study might have been improved and could be extended in the future.
This criterion assesses the student’s ability to review the investigative methodology, by weighing up the strengths and/or weaknesses of the chosen method, and suggest improvements

|Evaluation|

|Evaluation|
